Aquarium Statistics 2026

The AquaGauge real-tank dataset spans 6,414 aquariums. The median tank is 20 gallons, median pH is 7.4, and median nitrate is 10 ppm — alongside sourced public stats on the hobby, the money, and the fish. About 10 million US households keep freshwater fish (APPA, 2025).
Key aquarium statistics (July 2026)
Each line below is a complete, sourced statistic. Copy them freely; how to cite this page.
- The median home aquarium is 20 gallons, across 5,134 real tanks in the AquaGauge dataset (July 2026), and 58% of tanks are 20 gallons or smaller.
- The median pH in a home aquarium is 7.4, and 71% of tanks read between pH 7.0 and 8.0, across 741 real tanks in the AquaGauge dataset (July 2026).
- Median nitrate in a home aquarium is 10 ppm, and 83% of tanks read 20 ppm or lower, across 1,015 real tanks in the AquaGauge dataset (July 2026).
- 31% of the 902 tanks in the AquaGauge dataset that posted an ammonia reading showed ammonia above 0 ppm (July 2026), a sign of an uncycled or struggling tank.
- Betta keepers run a median 10-gallon tank, and 32% use a 5-gallon, across 542 real betta tanks in the AquaGauge dataset (July 2026).
- Shrimp keepers run the smallest tanks in the hobby: a median 6 gallons across 390 real shrimp tanks in the AquaGauge dataset (July 2026).
- About 10 million US households keep freshwater fish per APPA (2025); the AVMA counts 3.4 million fish-owning households (2025), so the honest figure is a 3–10 million range.
- The US pet industry reached $158 billion in 2025 and is projected at $165 billion in 2026 (APPA).
Aquarium statistics at a glance (6,414 real tanks, July 2026 snapshot)
| The real-tank number (AquaGauge dataset) | Value | What the public benchmark says |
|---|---|---|
| Median tank volume | 20 gallons (n=5,134) | Advice threads often push a 55-gallon “starter” |
| Tanks 20 gallons or smaller | ~58% | 10g and 20g are the retail standards |
| Median pH | 7.4 (n=741) | Beginners aim for a neutral 7.0 |
| Median nitrate | 10 ppm (n=1,015) | Keep under 40 ppm; under 20 is better |
| Median ammonia / nitrite | 0 ppm / 0 ppm | Both should read 0 in a cycled tank |
| Median temperature | 78 °F (n=369) | Typical tropical community range |
| US pet industry, 20251 | $158 billion | $165B projected for 2026 |
Two things drive this page. The public layer (how big the hobby is, how many people keep fish, where the money goes) comes from the APPA National Pet Owners Survey and the AVMA Sourcebook, each verified at the primary source. The real-tank layer (what people’s water, tanks, and stocking actually look like) comes from 6,414 aquariums whose owners posted a photo or a test result to a public aquarium forum. Those numbers exist nowhere else.
The thesis they add up to: hobbyists run their tanks smaller, softer, and cleaner than the beginner advice assumes, and the readings that look alarming cluster around the people who came online to ask for help.
The hobby: 3 to 10 million US households keep fish, and the two big surveys disagree by 3x
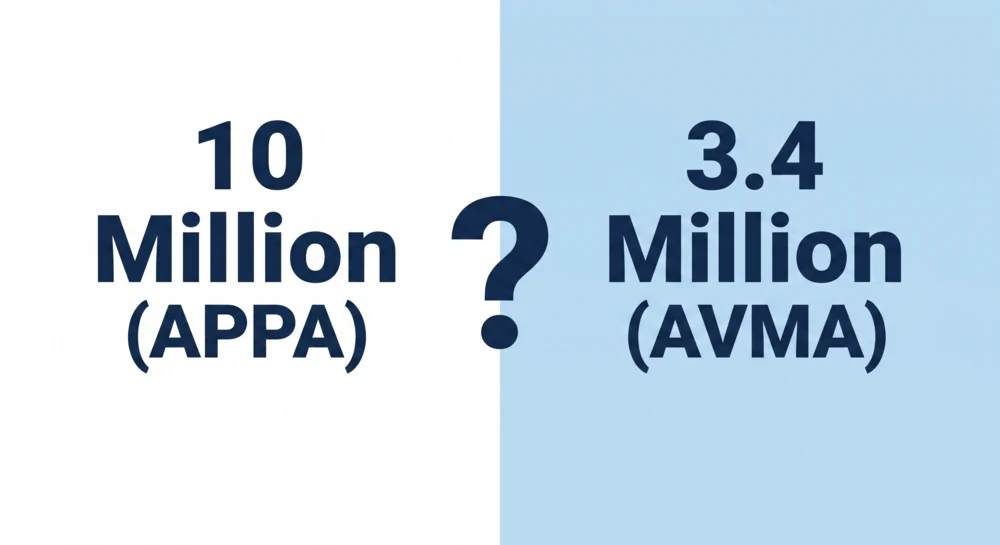
APPA’s 2025 Fish & Reptile Report puts freshwater fish in about 10 million US households, and saltwater fish in about 2 million.2 The AVMA’s 2025 Sourcebook counts more conservatively: fish in 3.4 million households, 2.6% of the country, well behind dogs (42.6%) and cats (32.6%).4
The 3x gap is not an error to resolve; it is the story. The two surveys ask different people in different ways, so the honest figure is a range, not a point. Anyone quoting a single “X million fishkeepers” number is hiding that. Under the AVMA count, fish are the third-most-kept pet, in 2.6% of households, behind dogs and cats,4 and the category is the one most likely to be undercounted, because a spare 10-gallon on a shelf is easy to forget on a survey.
Whether the hobby is growing depends on how you count. By total households it has drifted down since its 2013 peak, but the keepers who remain are more invested and younger. The trend section below lays out the full series.
The money: a $158 billion pet industry, and fishkeepers who buy in bulk
The US pet industry reached $158 billion in 2025 and is projected at $165 billion in 2026, per APPA’s State of the Industry report.1 That covers 95 million pet-owning households (APPA).3 Fish are a small slice of that spend, but a telling one, because aquarium spending scales with the number of tanks and fish a household runs, and both are climbing.
A majority of fish owners — 77% — now keep two or more fish, a 7% increase since 2018 (APPA, 2025).2 The single-goldfish-in-a-bowl household is the exception now. In felt terms: for every fishkeeper with one pet fish, roughly three keep a group, which is what a stocked community tank looks like. That shift, toward more fish per household, bigger tanks, and more equipment, is the engine under the category’s growth, and it lines up with what our own data shows about how the tanks are actually run.
The tanks: the median aquarium is 20 gallons, and most are smaller
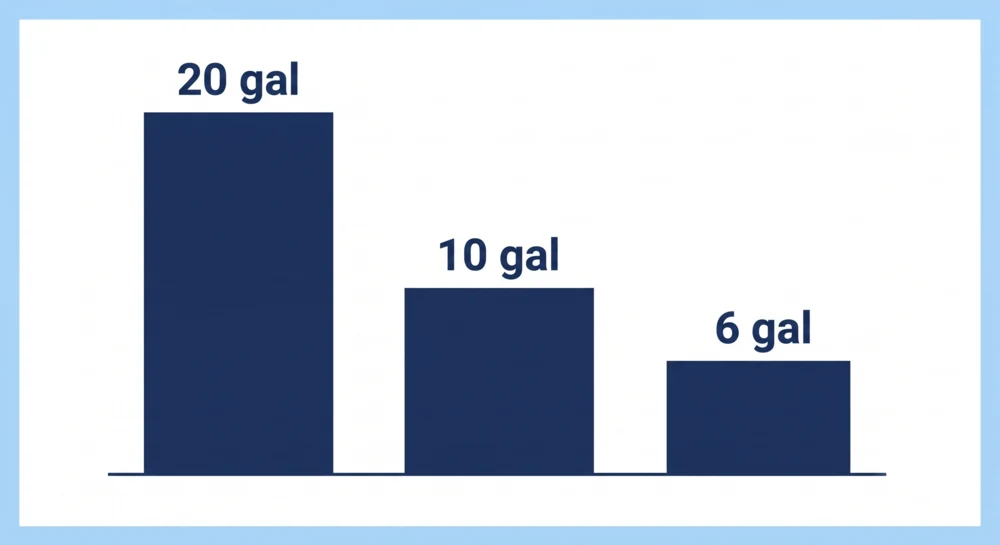
Across 5,134 real tanks in the AquaGauge dataset (July 2026), the median volume is 20 gallons and the middle 50% run 10 to 50 gallons. About 58% of tanks are 20 gallons or smaller, and 39% are 10 gallons or smaller (computed over the 5,134 tanks with a stated volume). A handful of big builds (one hit 1,200 gallons) pull the average up to 39 gallons, but that number describes almost nobody’s tank. The median 20 is the one to trust, and the one to quote.
The felt takeaway: the standard home aquarium is a 10 or a 20, not the 55-gallon “starter” tank that advice threads keep recommending. The two most common exact sizes in the data are the 10-gallon (18% of tanks) and the 5-gallon (14%).
Two subcultures pull smaller still. Betta keepers in the AquaGauge dataset run a median 10-gallon tank (n=542), with 32% on a 5-gallon and only 26% above 10 gallons. That is a real correction from the cup-and-bowl era, but still short of the 5-gallon minimum many care sheets now push, since 8% keep bettas under 5 gallons. Shrimp keepers run the smallest tanks in the AquaGauge dataset: a median 6 gallons (n=390), with 36% on a dedicated 5-gallon nano. Nano tanks are not a fringe; they are a large, deliberate share of the hobby.
The water: real tanks run slightly alkaline and cleaner than expected
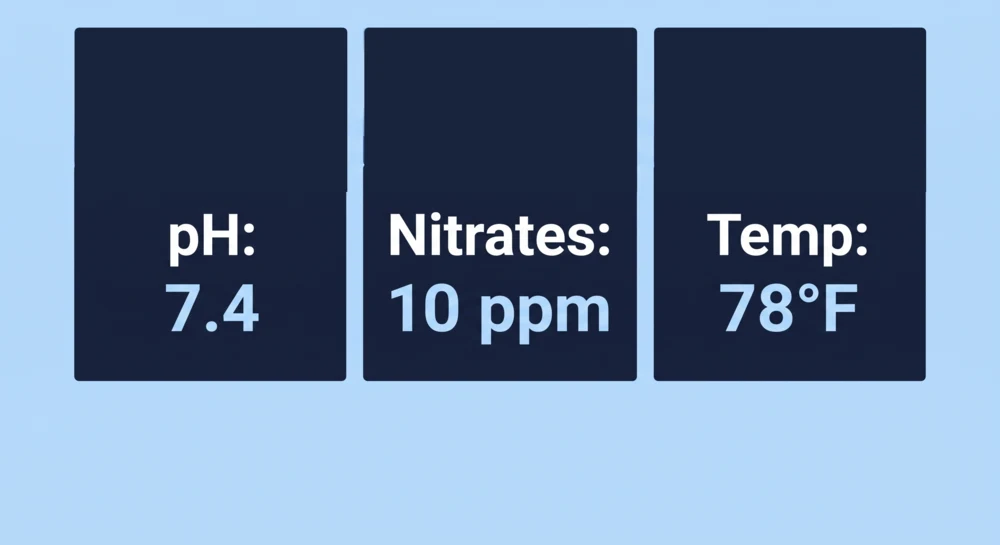
Across 741 real tanks in the AquaGauge dataset (July 2026), the median pH is 7.4, and 71% sit between pH 7.0 and 8.0. Only about a quarter (24%) run acidic, below 7.0. This corrects a common beginner belief: most freshwater community tanks are slightly alkaline, not the neutral 7.0 people chase. Unless you keep soft-water specialists, your tap-fed tank drifting to 7.4 is normal, and chasing it down to 7.0 usually causes more harm than the pH ever would.
On the nitrogen cycle, the readings are better than the internet’s horror stories suggest. In the AquaGauge dataset, median nitrate is 10 ppm across 1,015 tested tanks (July 2026), with 83% reading 20 ppm or lower and only 6% over 40 ppm. Median ammonia and median nitrite in the dataset both read 0 ppm (n=902 and n=733). Most tanks that get tested are, in fact, cycled and low-waste. Median water temperature in the dataset is 78 °F (n=369), squarely in the tropical community range.
The counter-intuitive finding: a third of tested tanks aren’t fully cycled
Here is the number that cuts against the tidy medians. In the AquaGauge dataset, 31% of the 902 tanks that posted an ammonia reading showed ammonia above 0 ppm, and 34% of the 733 tanks that posted a nitrite reading showed nitrite above 0 ppm (July 2026). In a cycled tank both should be 0. So while the typical tank reads clean, roughly one in three of the tanks putting a test result online is mid-crisis.
That is not evidence the hobby is bad at cycling. It is selection bias, and it is worth stating plainly: our data comes from people posting to public aquarium forums, and people post an ammonia reading precisely when it is scary. The clean median is the real hobby; the alarming tail is the help queue. Read every number on this page with that in mind. The low end reflects well-run tanks, the high end reflects keepers fixing a problem, and both are over-represented relative to the silent middle.
The fish: how many, per gallon, real keepers actually put in
Stocking is where advice and reality diverge most, and where our per-gallon data is most useful. These figures come from tanks in the AquaGauge dataset (July 2026) that stated both a species and a headcount, so the samples are smaller, but they are real placements, not rules of thumb.
- Corydoras: across 173 sized tanks in the AquaGauge dataset, the median stocking is about 0.2 cory per gallon. In the popular 11-to-20-gallon range, that works out to a median of 5 corydoras (n=71), which matches the “keep them in groups of 6+” guidance better than the old one-inch-per-gallon rule does.
- Shrimp: across 68 sized tanks in the AquaGauge dataset, a median of about 0.5 shrimp per gallon, with a max well above that. Shrimp colonies scale far past what fish stocking rules would allow, because their bioload is tiny.
- Guppies: across 31 sized tanks in the AquaGauge dataset, about 0.3 guppy per gallon, reflecting how fast live-bearers multiply once a tank is established.
The takeaway for a new keeper: real stocking is lighter, per gallon, than beginners fear. The median community tank is not packed, and stocking varies by animal far more than any single “inch per gallon” rule captures. Size your own tank with the stocking calculator rather than a blanket ratio.
The count: fish are the most numerous pet in America
Counted by household, fish are the third pet. Counted by head, they are the first. Americans keep an estimated 139 million freshwater fish and 19 million saltwater fish, about 158 million pet fish in all, more individual animals than cats (94 million) or dogs (90 million).10 That figure traces to APPA’s 2017–2018 National Pet Owners Survey, the most recent fish headcount published in citable form, so treat it as a 2017–18 number. The contrast is the line worth quoting: fish rank third by household but first by headcount, because one fishkeeper’s tank holds a school, not a single pet.
The industry: a $6 billion to $30 billion market, depending on what you count
“How big is the aquarium industry?” has no single answer, because published figures measure three different things:
- Live fish only. The global ornamental-fish market (the animals, not the gear) was valued at about $6.9 billion in 2025 and is forecast near $13.6 billion by 2034.5
- Tanks and equipment. The “aquarium market” (tanks, filters, heaters, lighting) is put at $8.9 billion for 2024 by one research firm and $19.7 billion for 2026 by another,76 a 2x disagreement on the same nominal scope, reason enough not to quote any single number.
- The whole ecosystem. Counting retail sales, wages, and non-exported stock, the FAO’s GLOBEFISH has cited estimates of $15–30 billion a year for the full industry.8
For contrast, the customs value of the global ornamental-fish trade is far smaller. FAO trade data runs from $21.5 million in 1976 to $347.5 million in 2014, which is why “trade value” and “industry value” differ by roughly 50x.9 The honest takeaway: cite a range with its scope attached, not a headline figure.
The trend: fewer households, but deeper engagement
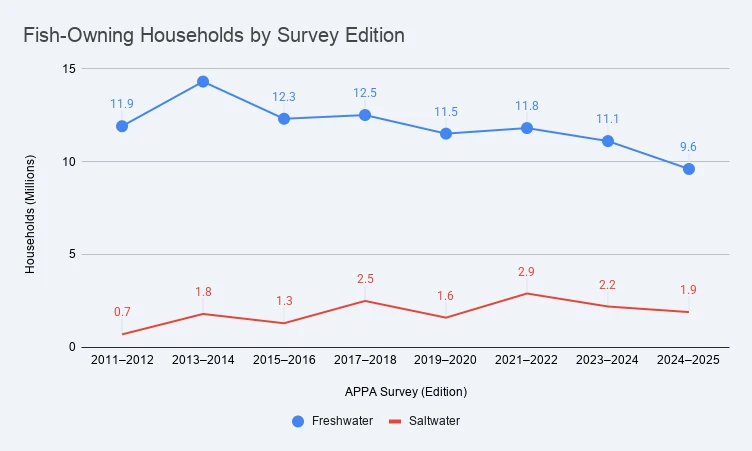
By household count, freshwater fishkeeping peaked at 14.3 million US households in APPA’s 2013–2014 survey and has slid to about 9.6 million by 2024–2025, down roughly a third.11
| APPA survey (edition) | Freshwater fish households | Saltwater |
|---|---|---|
| 2011–2012 | 11.9M | 0.7M |
| 2013–2014 | 14.3M (peak) | 1.8M |
| 2015–2016 | 12.3M | 1.3M |
| 2017–2018 | 12.5M | 2.5M |
| 2019–2020 | 11.5M | 1.6M |
| 2021–2022 | 11.8M | 2.9M |
| 2023–2024 | 11.1M | 2.2M |
| 2024–2025 | 9.6M | 1.9M |
The keepers who remain are more invested, though. 77% of fish owners keep two or more fish, up 7% since 2018,2 and specific cohorts are still growing. APPA’s 2026 report notes freshwater fish ownership rose 17% year over year among Gen X households.1 So the honest answer to “is the hobby growing” is: fewer households overall, deeper engagement per household. These are biennial survey editions, so any source showing a smooth year-by-year fish-household line is interpolating between them.
Who keeps fish: a younger, more invested hobby
Fishkeeping is skewing younger. Millennials now make up 46% of saltwater fish owners and 38% of freshwater owners, up 15% and 9% from 2023.2 And equipment is following the money: 70% of freshwater owners now run aquarium lighting, up 32% since 2018.2 The casual single-fish household is receding; the committed, better-equipped keeper is what remains.
What it costs to start: about $200 for a 10-gallon, $250 for a 20-gallon
APPA publishes total pet-industry spend ($158 billion in 2025)1 but no free, fish-specific annual dollar figure, so we priced a beginner setup ourselves at US retail. As of July 2026, a complete 10-gallon freshwater setup runs about $200 and a 20-gallon about $250. A 10-gallon build totals $198.94: an Aqueon LED kit ($109.99), a 50W heater ($24.99), substrate ($13.32), water conditioner ($5.99), an API Freshwater Master Test Kit ($35.98), and flake food ($8.67). The same list at 20 gallons with a 100W heater comes to $251.90. After setup, plan on about $64 a year in consumables: conditioner, filter cartridges, food, and the test kit amortized over its ~800-test life. These are single-retailer list prices captured in July 2026, so treat them as a mid-range benchmark, not a fixed cost, and note they exclude livestock, plants, decor, a stand, and electricity.
Public aquariums: the other aquarium statistics
Search “aquarium statistics” and you also get public aquariums. The Association of Zoos and Aquariums accredits 254 facilities across 12 countries, 229 of them in the US, of which 56 are aquariums and 9 are combined zoo-aquariums.12 Together, AZA-accredited zoos and aquariums drew more than 209 million visitors, generated $35 billion in economic impact, and supported over 254,000 jobs in 2024.12 AZA reports visitors and economics for zoos and aquariums combined, not aquariums alone, and many public aquariums operate without AZA accreditation.
Based on real tanks (the moat)
Everything labeled “AquaGauge dataset” above is computed from 6,414 real aquariums whose owners posted a photo, a spec, or a water test to a public forum, primarily across 12 aquarium subreddits (r/aquariums, r/bettafish, r/plantedtank, r/shrimptank, r/corydoras, r/cichlid, r/goldfish, r/guppies, r/discus, r/aquascape, r/fishtank, r/aquariumhelp). Coverage varies by measure: 5,134 tanks reported a volume, 1,015 a nitrate reading, 741 a pH, so each stat carries its own sample size.
The honest caveat: this is a self-selected sample of people who chose to post, and many posted because something was wrong. That biases the extremes: expect the low, clean readings to represent well-run tanks and the alarming outliers to represent keepers mid-problem. Medians are the most trustworthy figures here; the tails are not a random sample of all aquariums.
Statistics by topic
Deeper cuts of the same dataset, each computed from the July 2026 snapshot:
- Betta fish statistics — 542 real betta tanks: sizes, pH, temperature, nitrate.
- Shrimp tank statistics — 390 real shrimp tanks: sizes, stocking density, water.
- Aquarium stocking statistics — real fish-per-gallon rates by species.
How to cite this page
Cite the real-tank figures as: “AquaGauge Aquarium Statistics 2026, theaquagauge.com/aquarium-statistics/ (July 2026 snapshot of 6,414 real tanks).” The aggregate statistics are licensed CC BY 4.0: use them freely, with attribution; a link back is appreciated.
Download the full aggregate dataset: JSON · CSV — per-measure medians, quartiles and distributions, plus per-species stocking rates. The public-layer statistics (APPA, AVMA) belong to their producers; cite those at the source.
Methodology
The public statistics on this page each trace to a primary producer, the APPA National Pet Owners Survey / State of the Industry Report and the AVMA Pet Ownership and Demographics Sourcebook, not to a secondary listicle, and each figure was re-checked against that source with its original year attached. Where two surveys disagree, as with the number of fish-owning households, we report the range and name both. We dropped one commonly cited stat, a single “global aquarium market size,” because the market-research figures we could find conflicted by more than 2x and none was verifiable at a primary source.
The real-tank statistics are computed directly from the AquaGauge dataset (6,414 tanks in the July 2026 snapshot; posts spanning August 2010 through May 2025) with an open-source tool, not estimated from memory. Medians, quartiles, and distributions are calculated over only the tanks that reported each measure. This page is maintained by Yevhen Bulhakov, editor of AquaGauge. Read more about how we collect the data.
Cite these figures freely (CC BY 4.0); a link back to AquaGauge is appreciated. The real-tank numbers, in particular, are ours and exist nowhere else.
FAQ
- How many households keep aquarium fish in the US?
- About 10 million US households keep freshwater fish and about 2 million keep saltwater fish, per APPA's 2025 Fish & Reptile Report. The AVMA's 2025 Sourcebook counts fish-owning households more conservatively at 3.4 million (2.6% of households); the two surveys use different methods, so treat the range as 3–10 million.
- What is the average home aquarium size?
- Across the 5,134 tanks that reported a size (of 6,414 in the AquaGauge dataset), the median tank volume is 20 gallons and the middle 50% run 10 to 50 gallons. About 58% are 20 gallons or smaller. The 10-gallon and 20-gallon standards dominate.
- What is the average pH in a home aquarium?
- Across 741 real tanks that posted a pH reading, the median is 7.4 and 71% sit between pH 7.0 and 8.0. Most freshwater community tanks run slightly alkaline, not the neutral 7.0 beginners aim for.
- What is a normal nitrate level in a fish tank?
- Across 1,015 real tanks that posted a nitrate reading, the median is 10 ppm and 83% read 20 ppm or lower. Keep nitrate under 40 ppm; under 20 is better. Ammonia and nitrite should read 0 in a cycled tank.
- Is the aquarium hobby growing?
- In dollars, yes: the US pet industry reached $158 billion in 2025 and is projected at $165 billion in 2026 (APPA). Household counts are harder to read — freshwater fish ownership rose 17% year over year among Gen X households in APPA's 2026 report, but total fish-owning household estimates vary by survey (3–10 million). Growth is real in spending and in specific cohorts, not a uniform boom.
Sources
- U.S. Pet Industry Reaches $158 Billion in 2025, Poised for Continued Growth in 2026, American Pet Products Association (APPA) State of the Industry Report (2026). View source ↗
- From Bigger Tanks to Stronger Bonds: Fish & Reptile Ownership Evolves in 2025, APPA National Pet Owners Survey (2025 Fish & Reptile Report) (2025). View source ↗
- Pet Industry Market Size, Trends & Ownership Statistics, American Pet Products Association (APPA) (2026). View source ↗
- U.S. Pet Ownership Statistics, American Veterinary Medical Association (AVMA) Pet Ownership and Demographics Sourcebook (2025). View source ↗
- Ornamental Fish Market Size, Share & Trends, Straits Research (2025). View source ↗
- Aquarium Market Report, Business Research Insights (2026). View source ↗
- Aquarium Market Research Report, Market Research Future (2024). View source ↗
- 3rd International Ornamental Fish Trade and Technical Conference (industry value estimate), FAO GLOBEFISH (2020). View source ↗
- A Systematic Review of the Ornamental Fish Trade with Emphasis on Coral Reef Fishes, Animals (Basel) (2020). View source ↗
- An Introduction to Human–Animal Interaction Research (US pet population figures via APPA/III), Int. J. Environ. Res. Public Health (2019). View source ↗
- Facts + Statistics: Pet ownership and insurance (APPA National Pet Owners Survey, historical editions), Insurance Information Institute (2025). View source ↗
- Visitor Demographics / Zoo and Aquarium Statistics, Association of Zoos and Aquariums (AZA) (2026). View source ↗

Freshwater aquarist of 8+ years.